Publicly Available Data from KIDS COUNT
Annie E. Casey Foundation, “Kidscount”
Publicly available data from the Annie E. Casey Foundation provides snapshots of socio-economic and educational standing of children at the county level. We refer to the data we compiled from the foundation’s data collection initiative, KIDS COUNT, as the Kidscount data in our data directory, GitHub repo file paths, and blog posts. If you would like similar information for your own area, Kidscount contains data for each of the fifty states, the District of Columbia, Puerto Rico, Virgin Islands, and the aggregated U.S..
Oregon Student Academic Performance
Kidscount variables include county rates of student proficiency in math and reading using third and eighth grade assessments. In the 2014-2015 school year, Oregon’s counties ranged from about 37 to 75 percent of their students (in schools that receive public funding) rated proficient in math at grade three and ranging from around 33 to 80 percent at grade eight.
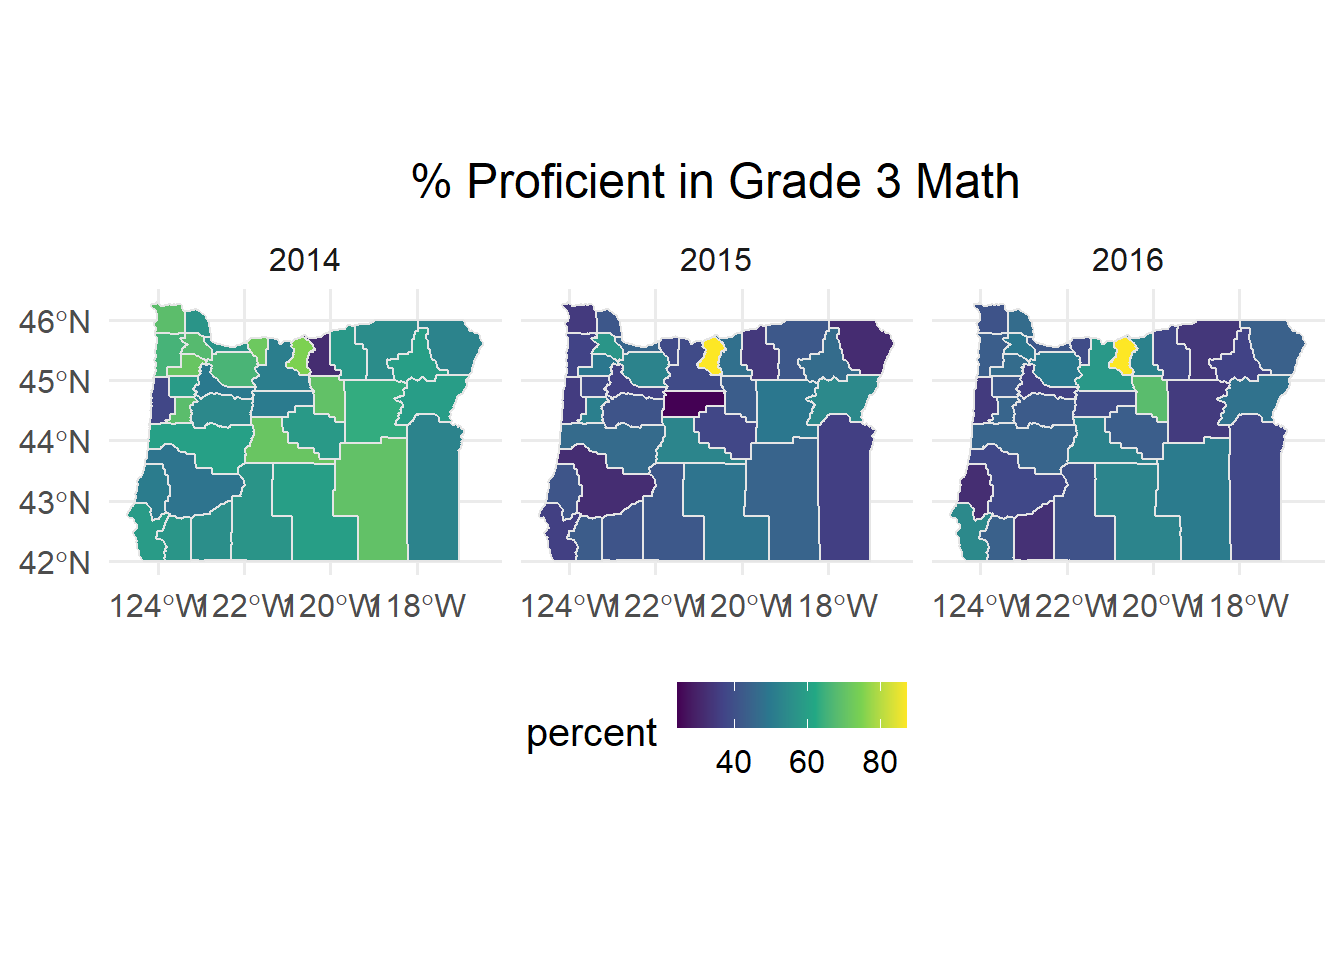 The above displays differences by county across years reported by Kidscount in the percentage of proficient students in math.
Reading proficiency among Oregon students in that same year ranges by county from apporximately 47 to 82 percent of third grade students and around 48 to 81 percent of eighth grade students. Gilliam and Lincoln counties appear most consistently with the lowest rates of proficiency across grades and subjects. On the high-achieving end, Sherman County leads across subjects and grades three for four.
Oregon Children’s Health & Safety Indicators
There is clear evidence that academic achievement and health outcomes are inter-related, with each influencing the other.1 Educational outcomes impact health most directly through future socioeconomic status (including neighborhood residence), but lower education levels are also associated with increased risky behavior, including smoking, reduced physical activity, and early sexual activity.2
With that in mind, we include a number of county-level health variables in our Kidscount data. They include (among others): percentage of children living in food insecure households, abuse and neglect rates, threat of harm rates, children in foster care and the juvenile justice system, infant mortality, teen pregnancy, low birthweights, adequate prenatal care, and immunization rates.
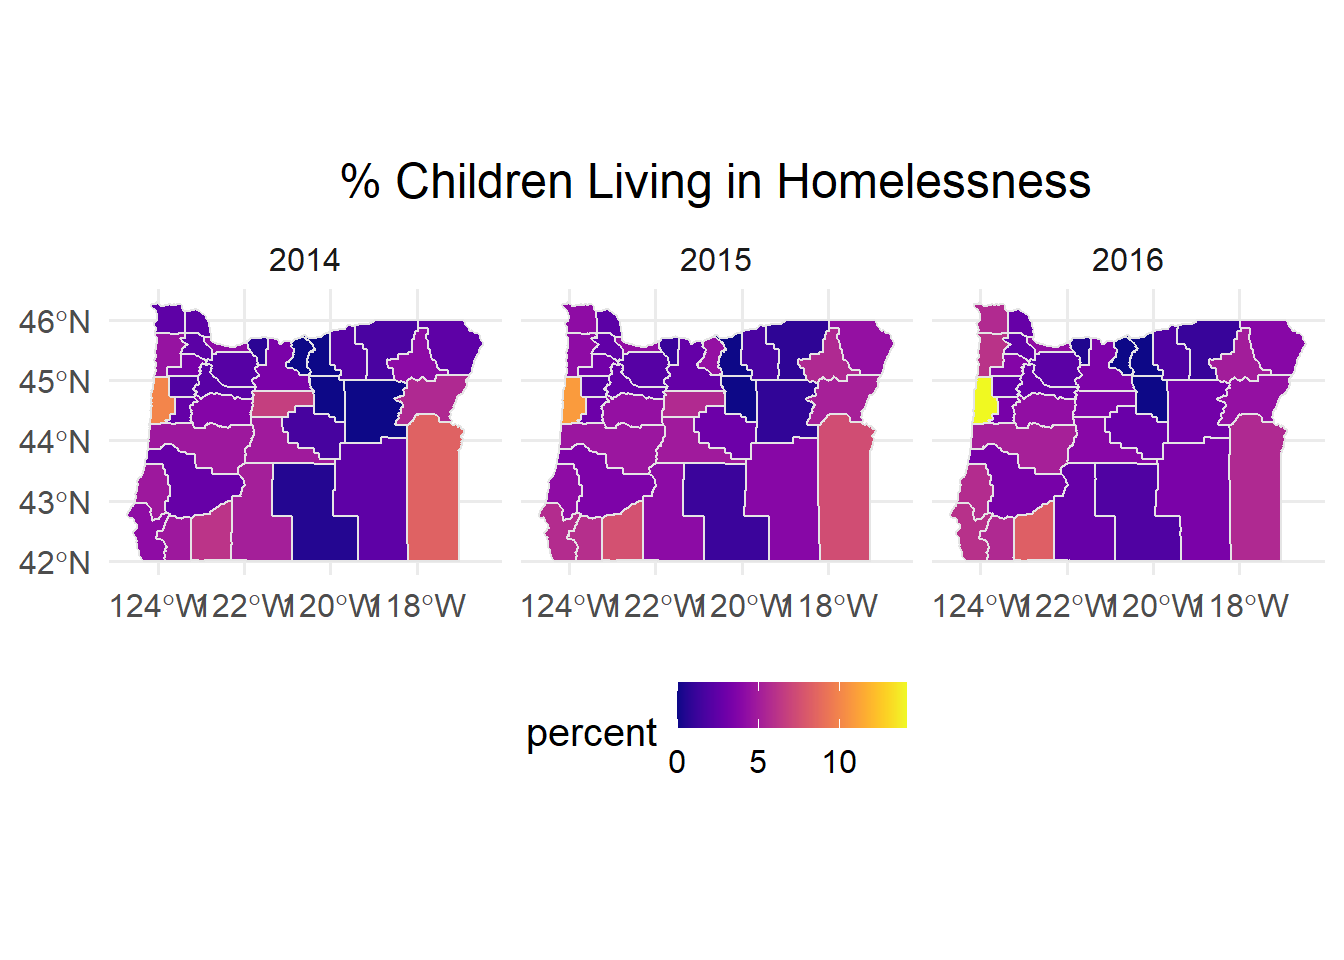 By county, the reported 2016 rates of child homelessness in Oregon range from 0 to 14.2 percent and the rate of children without healthcare runs from 3 to 10 percent. Oregon counties with the lowest rates of child immunization are Curry County with over 56% of children lacking completed immunization schedules and Coos County with over 48% of children in need of updated immunizations. Indicators such as immunization rates show not only an area’s child population’s risk of disease but can also serve as proxy for unobservable information such as a community’s children’s access to adequate healthcare.
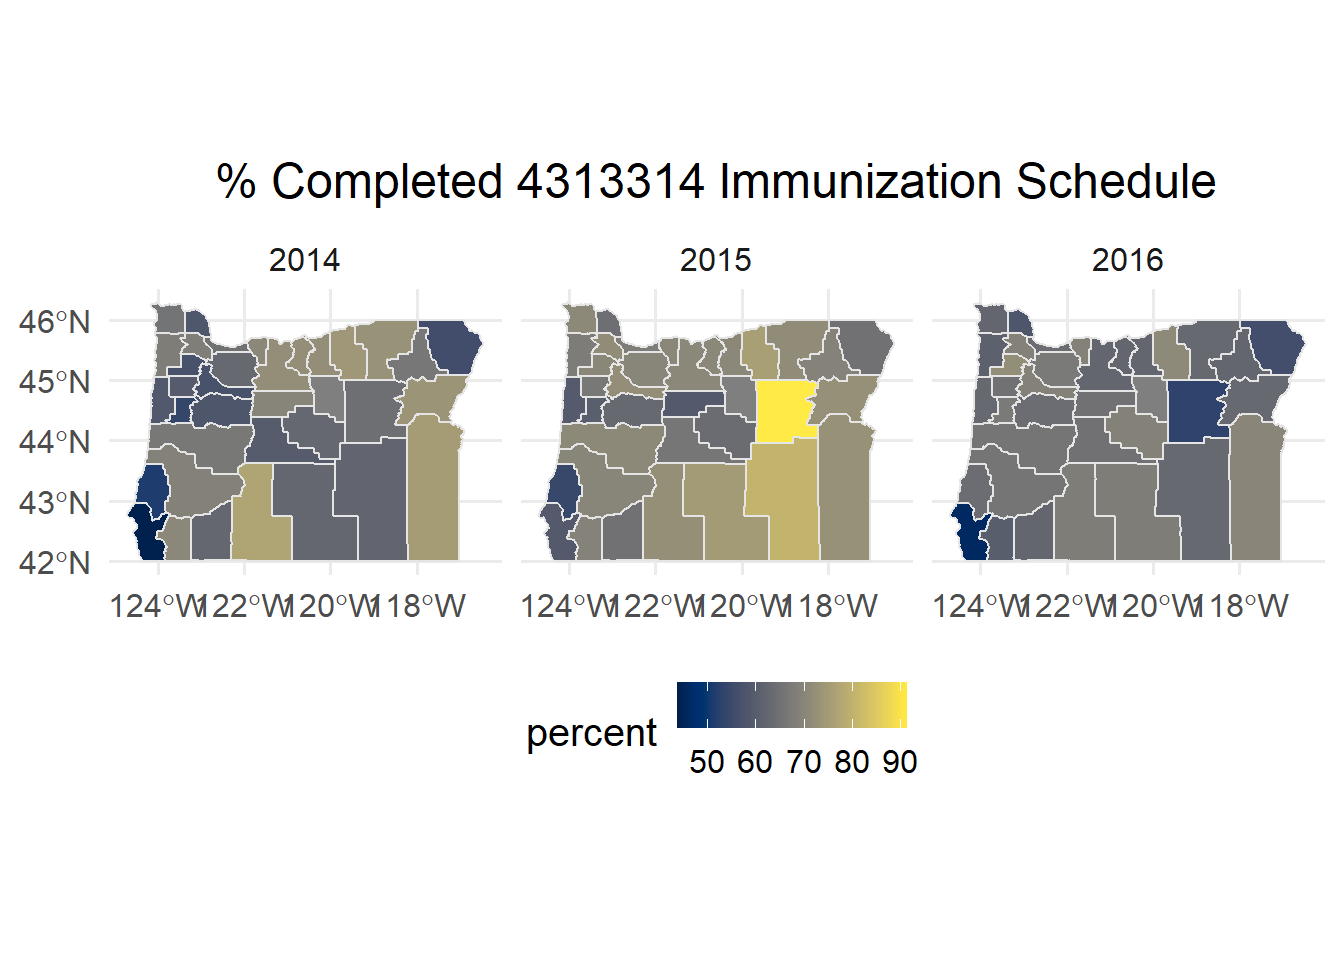
References
Basch, C. E. (2011). Healthier students are better learners: A missing link in school reforms to close the achievement gap. Journal of School Health, 81 (10), 593–598. &
Fiscella, K., & Kitzman, H. (2009). Disparities in academic achievement and health: the intersection of child education and health policy. Pediatrics, 123(3), 1073-1080.↩Fiscella, K., & Kitzman, H. (2009). Disparities in academic achievement and health: the intersection of child education and health policy. Pediatrics, 123(3), 1073-1080.↩